由于机型使用时间受限,故测试只进行了 sysbench 的基准测试,后续可能会补充完整性能和功能测评。
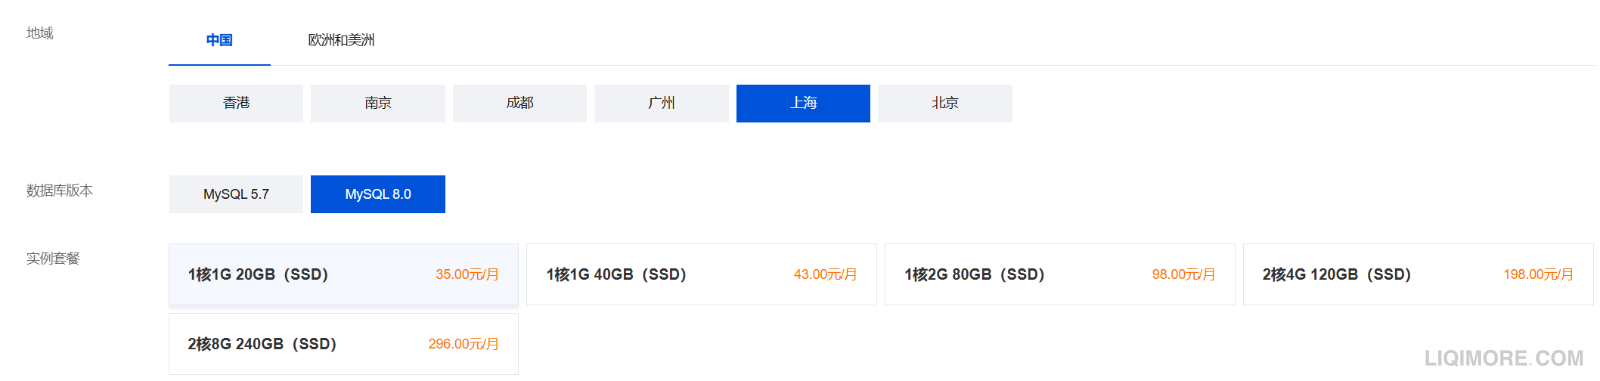
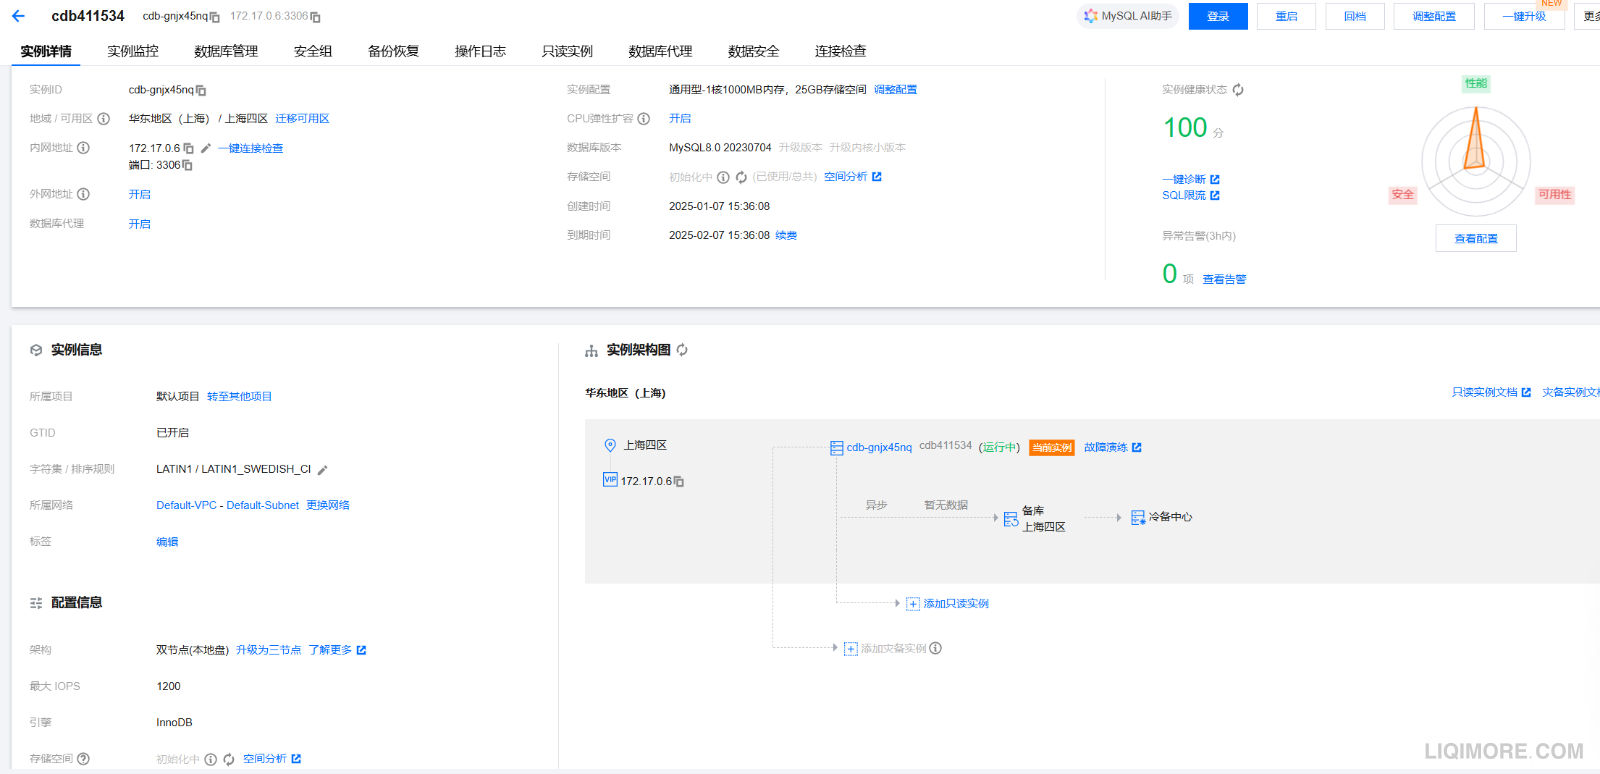
腾讯云轻量数据库
1核心1G,上海实例测试
测试命令:
sysbench oltp_read_write --mysql-host=10.0.4.13 --mysql-port=3306 --mysql-user=root --mysql-password=Test@1234! --mysql-db=sbtest --tables=30 --table-size=100000 --threads=30 prepare

sysbench oltp_read_write --mysql-host=10.0.4.13 --mysql-port=3306 --mysql-user=root --mysql-password=Test@1234! --mysql-db=sbtest --tables=30 --table-size=100000 --threads=30 prewarm

sysbench oltp_read_write --mysql-host=10.0.4.13 --mysql-port=3306 --mysql-user=root --mysql-password=Test@1234! --mysql-db=sbtest --tables=30 --table-size=100000 --threads=16 --time=3600 --report-interval=10 run
sysbench 1.0.20 (using system LuaJIT 2.1.0-beta3)
Running the test with following options:
Number of threads: 16
Report intermediate results every 10 second(s)
Initializing random number generator from current time
Initializing worker threads...
Threads started!
[ 10s ] thds: 16 tps: 704.79 qps: 14123.44 (r/w/o: 9888.99/2823.27/1411.18) lat (ms,95%): 86.00 err/s: 0.00 reconn/s: 0.00
[ 20s ] thds: 16 tps: 701.40 qps: 14016.82 (r/w/o: 9811.12/2802.90/1402.80) lat (ms,95%): 86.00 err/s: 0.00 reconn/s: 0.00
[ 30s ] thds: 16 tps: 759.50 qps: 15198.90 (r/w/o: 10640.10/3039.80/1519.00) lat (ms,95%): 82.96 err/s: 0.00 reconn/s: 0.00
[ 40s ] thds: 16 tps: 791.50 qps: 15827.80 (r/w/o: 11079.40/3165.40/1583.00) lat (ms,95%): 77.19 err/s: 0.00 reconn/s: 0.00
[ 50s ] thds: 16 tps: 782.60 qps: 15651.67 (r/w/o: 10955.38/3131.19/1565.10) lat (ms,95%): 80.03 err/s: 0.00 reconn/s: 0.00
[ 60s ] thds: 16 tps: 847.00 qps: 16942.40 (r/w/o: 11860.10/3388.20/1694.10) lat (ms,95%): 74.46 err/s: 0.00 reconn/s: 0.00
SQL statistics:
queries performed:
read: 642390
write: 183540
other: 91770
total: 917700
transactions: 45885 (763.94 per sec.)
queries: 917700 (15278.75 per sec.)
ignored errors: 0 (0.00 per sec.)
reconnects: 0 (0.00 per sec.)
General statistics:
total time: 60.0622s
total number of events: 45885
Latency (ms):
min: 4.53
avg: 20.93
max: 98.30
95th percentile: 82.96
sum: 960562.18
Threads fairness:
events (avg/stddev): 2867.8125/235.27
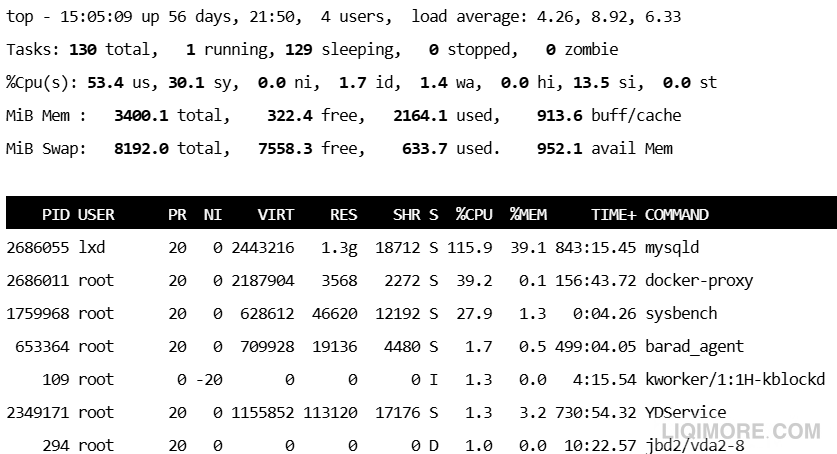
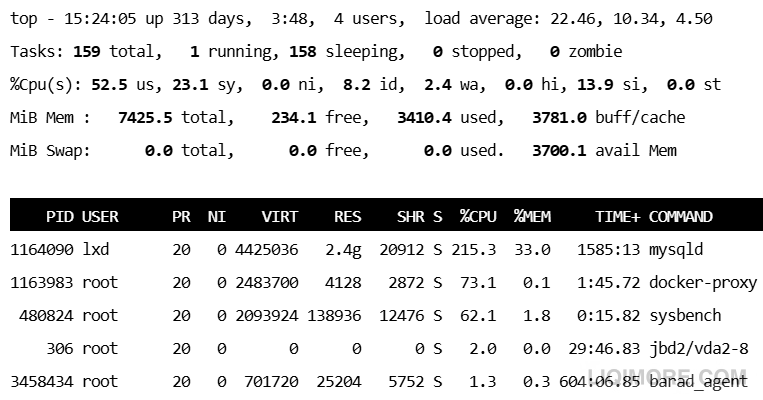
execution time (avg/stddev): 60.0351/0.01在测试期间,CPU使用率达到了100%,内存最高位60%。
自建Mysql8.4.3
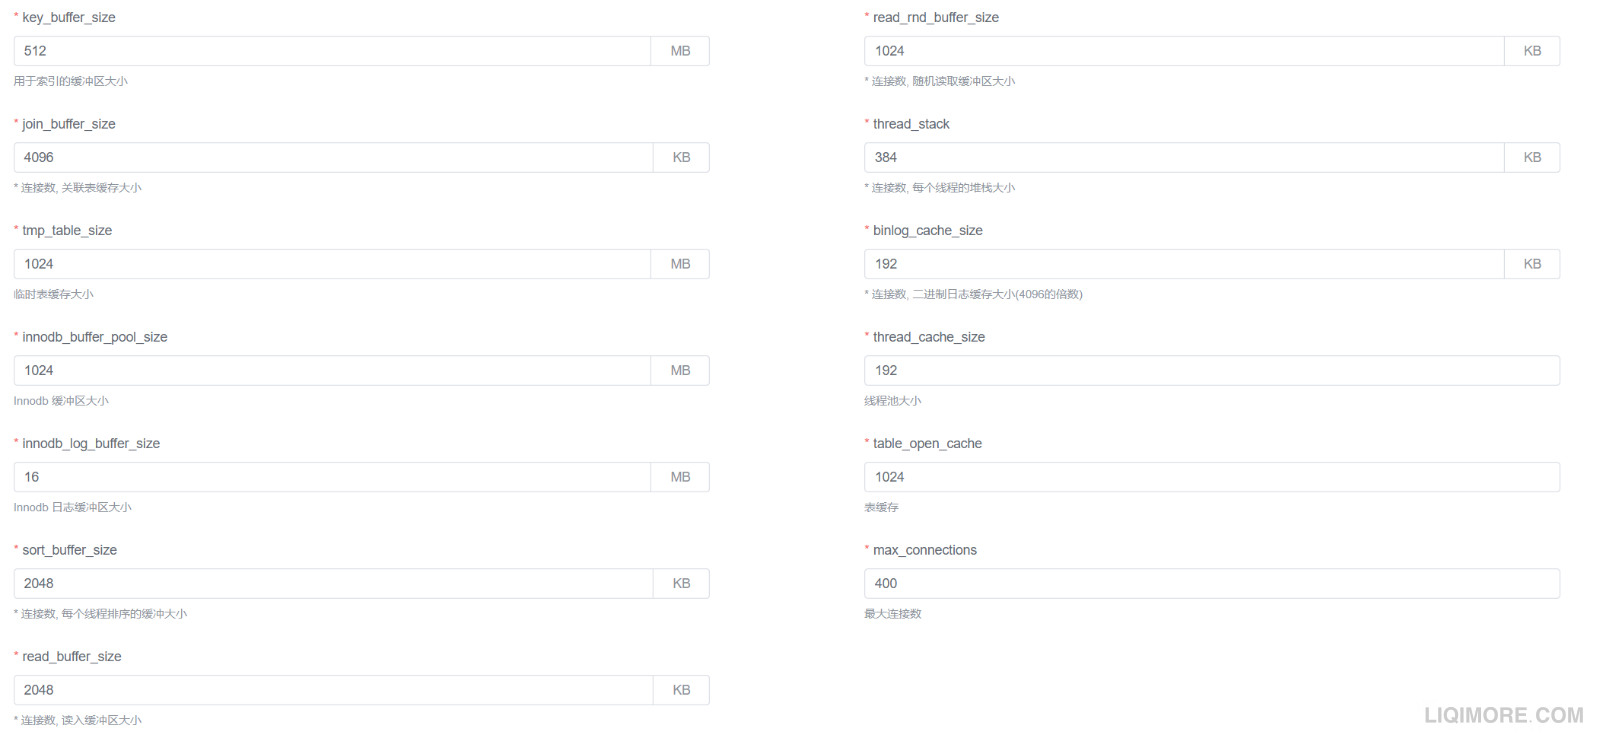
使用1panel容器化部署mysql8.4.3,按照如下参数配置:
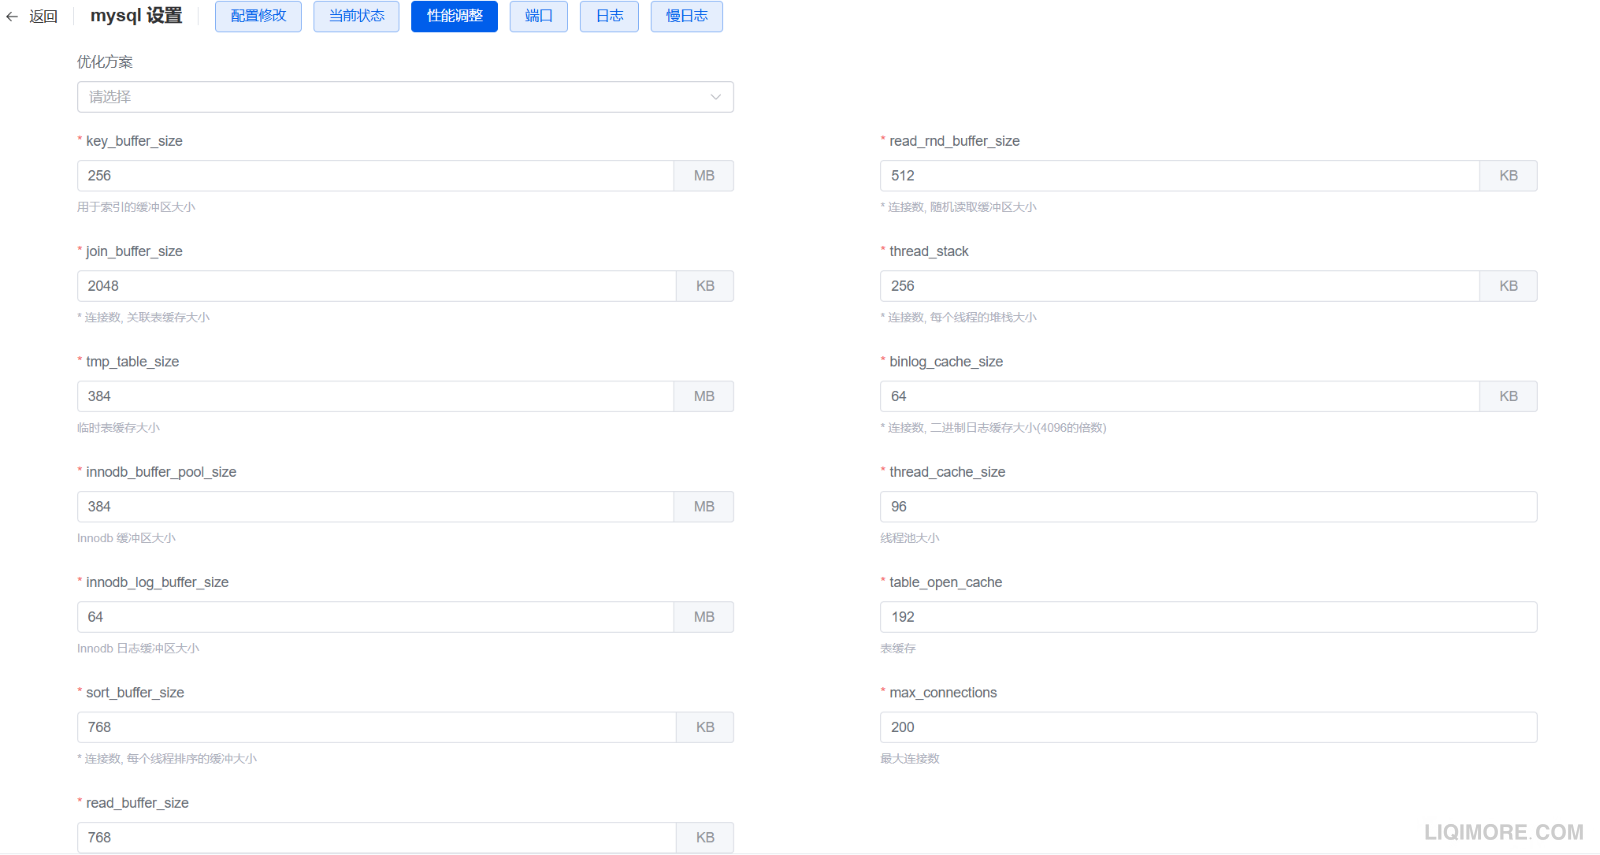
机器为2核4G,SSD云硬盘,硅谷2区,CPU为 E5-26xx v4。
用同样的指令测试,性能数据如下:
sysbench oltp_read_write --mysql-host=127.0.0.1 --mysql-port=3306 --mysql-user=sbtest --mysql-password=sbtest --mysql-db=sbtest --tables=30 --table-size=100000 --threads=8 --time=60 --report-interval=10 run

[ 10s ] thds: 8 tps: 139.47 qps: 2798.75 (r/w/o: 1960.75/558.27/279.74) lat (ms,95%): 90.78 err/s: 0.00 reconn/s: 0.00
[ 20s ] thds: 8 tps: 130.20 qps: 2605.47 (r/w/o: 1823.85/521.21/260.41) lat (ms,95%): 108.68 err/s: 0.00 reconn/s: 0.00
[ 30s ] thds: 8 tps: 134.00 qps: 2679.80 (r/w/o: 1876.40/535.40/268.00) lat (ms,95%): 97.55 err/s: 0.00 reconn/s: 0.00
[ 40s ] thds: 8 tps: 141.70 qps: 2830.59 (r/w/o: 1980.40/566.80/283.40) lat (ms,95%): 92.42 err/s: 0.00 reconn/s: 0.00
[ 50s ] thds: 8 tps: 130.50 qps: 2615.61 (r/w/o: 1831.71/522.90/261.00) lat (ms,95%): 106.75 err/s: 0.00 reconn/s: 0.00
[ 60s ] thds: 8 tps: 141.00 qps: 2813.91 (r/w/o: 1969.11/562.90/281.90) lat (ms,95%): 94.10 err/s: 0.00 reconn/s: 0.00
SQL statistics:
    queries performed:
        read:                            114478
        write:                           32708
        other:                           16354
        total:                           163540
    transactions:                        8177   (136.05 per sec.)
    queries:                             163540 (2720.91 per sec.)
    ignored errors:                      0      (0.00 per sec.)
    reconnects:                          0      (0.00 per sec.)

General statistics:
    total time:                          60.1031s
    total number of events:              8177

Latency (ms):
         min:                                   14.81
         avg:                                   58.75
         max:                                  217.94
         95th percentile:                       97.55
         sum:                               480394.56

Threads fairness:
    events (avg/stddev):           1022.1250/18.94
    execution time (avg/stddev):   60.0493/0.03
自建Mysql8.2.0
上海4C8G,上海2区,mysql8.2.0,CPU为Platinum 8255C CPU @ 2.50GHz。
测试:
sysbench oltp_read_write --mysql-host=127.0.0.1 --mysql-port=3306 --mysql-user=sbtest --mysql-password=sbtest --mysql-db=sbtest --tables=30 --table-size=100000 --threads=32 --time=60 --report-interval=10 run

[ 10s ] thds: 32 tps: 509.10 qps: 10237.55 (r/w/o: 7171.23/2044.91/1021.41) lat (ms,95%): 102.97 err/s: 0.00 reconn/s: 0.00
[ 20s ] thds: 32 tps: 520.41 qps: 10397.48 (r/w/o: 7278.60/2078.06/1040.83) lat (ms,95%): 101.13 err/s: 0.00 reconn/s: 0.00
[ 30s ] thds: 32 tps: 509.90 qps: 10206.11 (r/w/o: 7142.04/2044.28/1019.79) lat (ms,95%): 104.84 err/s: 0.00 reconn/s: 0.00
[ 40s ] thds: 32 tps: 517.00 qps: 10325.01 (r/w/o: 7230.91/2060.10/1034.00) lat (ms,95%): 99.33 err/s: 0.00 reconn/s: 0.00
[ 50s ] thds: 32 tps: 539.80 qps: 10810.08 (r/w/o: 7566.66/2163.82/1079.61) lat (ms,95%): 99.33 err/s: 0.00 reconn/s: 0.00
[ 60s ] thds: 32 tps: 527.20 qps: 10537.44 (r/w/o: 7376.66/2106.39/1054.39) lat (ms,95%): 99.33 err/s: 0.00 reconn/s: 0.00
SQL statistics:
    queries performed:
        read:                            437738
        write:                           125068
        other:                           62534
        total:                           625340
    transactions:                        31267  (520.25 per sec.)
    queries:                             625340 (10404.91 per sec.)
    ignored errors:                      0      (0.00 per sec.)
    reconnects:                          0      (0.00 per sec.)

General statistics:
    total time:                          60.0989s
    total number of events:              31267

Latency (ms):
         min:                                   11.17
         avg:                                   61.45
         max:                                  203.92
         95th percentile:                      101.13
         sum:                              1921249.64

Threads fairness:
    events (avg/stddev):           977.0938/11.14
    execution time (avg/stddev):   60.0391/0.02
腾讯云数据库

sysbench 1.0.20 (using system LuaJIT 2.1.0-beta3)

Running the test with following options:
Number of threads: 16
Report intermediate results every 10 second(s)
Initializing random number generator from current time


Initializing worker threads...

Threads started!

[ 10s ] thds: 16 tps: 699.35 qps: 13999.17 (r/w/o: 9801.35/2797.72/1400.11) lat (ms,95%): 41.85 err/s: 0.00 reconn/s: 0.00
[ 20s ] thds: 16 tps: 725.44 qps: 14513.60 (r/w/o: 10160.29/2902.44/1450.87) lat (ms,95%): 38.25 err/s: 0.00 reconn/s: 0.00
[ 30s ] thds: 16 tps: 736.40 qps: 14722.51 (r/w/o: 10304.91/2944.70/1472.90) lat (ms,95%): 36.89 err/s: 0.00 reconn/s: 0.00
[ 40s ] thds: 16 tps: 740.00 qps: 14801.58 (r/w/o: 10360.79/2960.80/1480.00) lat (ms,95%): 36.24 err/s: 0.00 reconn/s: 0.00
[ 50s ] thds: 16 tps: 693.50 qps: 13880.42 (r/w/o: 9717.92/2775.40/1387.10) lat (ms,95%): 41.85 err/s: 0.00 reconn/s: 0.00
[ 60s ] thds: 16 tps: 691.80 qps: 13826.74 (r/w/o: 9677.16/2766.09/1383.49) lat (ms,95%): 42.61 err/s: 0.00 reconn/s: 0.00
SQL statistics:
    queries performed:
        read:                            600348
        write:                           171528
        other:                           85764
        total:                           857640
    transactions:                        42882  (714.42 per sec.)
    queries:                             857640 (14288.31 per sec.)
    ignored errors:                      0      (0.00 per sec.)
    reconnects:                          0      (0.00 per sec.)

General statistics:
    total time:                          60.0225s
    total number of events:              42882

Latency (ms):
         min:                                   15.65
         avg:                                   22.39
         max:                                   77.03
         95th percentile:                       39.65
         sum:                               960077.36

Threads fairness:
    events (avg/stddev):           2680.1250/268.27
    execution time (avg/stddev):   60.0048/0.01
腾讯云原生数据库

sysbench 1.0.20 (using system LuaJIT 2.1.0-beta3)

Running the test with following options:
Number of threads: 16
Report intermediate results every 10 second(s)
Initializing random number generator from current time


Initializing worker threads...

Threads started!

[ 10s ] thds: 16 tps: 476.03 qps: 9538.71 (r/w/o: 6680.95/1904.10/953.65) lat (ms,95%): 89.16 err/s: 0.00 reconn/s: 0.00
[ 20s ] thds: 16 tps: 470.50 qps: 9412.82 (r/w/o: 6588.91/1882.90/941.00) lat (ms,95%): 89.16 err/s: 0.00 reconn/s: 0.00
[ 30s ] thds: 16 tps: 477.80 qps: 9551.82 (r/w/o: 6685.41/1910.80/955.60) lat (ms,95%): 89.16 err/s: 0.00 reconn/s: 0.00
[ 40s ] thds: 16 tps: 458.60 qps: 9177.38 (r/w/o: 6424.69/1835.50/917.20) lat (ms,95%): 89.16 err/s: 0.00 reconn/s: 0.00
[ 50s ] thds: 16 tps: 468.40 qps: 9367.08 (r/w/o: 6556.48/1873.80/936.80) lat (ms,95%): 89.16 err/s: 0.00 reconn/s: 0.00
[ 60s ] thds: 16 tps: 464.40 qps: 9284.60 (r/w/o: 6498.40/1857.40/928.80) lat (ms,95%): 89.16 err/s: 0.00 reconn/s: 0.00
SQL statistics:
    queries performed:
        read:                            394436
        write:                           112696
        other:                           56348
        total:                           563480
    transactions:                        28174  (469.06 per sec.)
    queries:                             563480 (9381.29 per sec.)
    ignored errors:                      0      (0.00 per sec.)
    reconnects:                          0      (0.00 per sec.)

General statistics:
    total time:                          60.0628s
    total number of events:              28174

Latency (ms):
         min:                                    5.04
         avg:                                   34.10
         max:                                  186.47
         95th percentile:                       89.16
         sum:                               960731.19

Threads fairness:
    events (avg/stddev):           1760.8750/66.38
    execution time (avg/stddev):   60.0457/0.00
物理机自建 Mysql
pve虚拟化环境,8核32G,CPU 独享且绑定在一个 numa 核心上,宿主机开启超线程:
8 x Intel(R) Xeon(R) Gold 6138 CPU @ 2.00GHz
32G

sysbench 1.0.20 (using system LuaJIT 2.1.0-beta3)

Running the test with following options:
Number of threads: 52
Report intermediate results every 10 second(s)
Initializing random number generator from current time


Initializing worker threads...

Threads started!

[ 10s ] thds: 52 tps: 790.21 qps: 15886.18 (r/w/o: 11127.42/3173.14/1585.62) lat (ms,95%): 132.49 err/s: 0.00 reconn/s: 0.00
[ 20s ] thds: 52 tps: 761.04 qps: 15211.43 (r/w/o: 10649.11/3040.35/1521.97) lat (ms,95%): 144.97 err/s: 0.00 reconn/s: 0.00
[ 30s ] thds: 52 tps: 786.61 qps: 15725.06 (r/w/o: 11003.28/3148.95/1572.83) lat (ms,95%): 134.90 err/s: 0.00 reconn/s: 0.00
[ 40s ] thds: 52 tps: 754.30 qps: 15098.30 (r/w/o: 10571.07/3018.42/1508.81) lat (ms,95%): 142.39 err/s: 0.00 reconn/s: 0.00
[ 50s ] thds: 52 tps: 752.69 qps: 15064.86 (r/w/o: 10544.71/3014.57/1505.59) lat (ms,95%): 155.80 err/s: 0.00 reconn/s: 0.00
[ 60s ] thds: 52 tps: 777.30 qps: 15537.96 (r/w/o: 10878.57/3104.69/1554.70) lat (ms,95%): 137.35 err/s: 0.00 reconn/s: 0.00
SQL statistics:
    queries performed:
        read:                            647850
        write:                           185100
        other:                           92550
        total:                           925500
    transactions:                        46275  (769.91 per sec.)
    queries:                             925500 (15398.28 per sec.)
    ignored errors:                      0      (0.00 per sec.)
    reconnects:                          0      (0.00 per sec.)

General statistics:
    total time:                          60.1025s
    total number of events:              46275

Latency (ms):
         min:                                   19.52
         avg:                                   67.46
         max:                                  461.28
         95th percentile:                      142.39
         sum:                              3121912.91

Threads fairness:
    events (avg/stddev):           889.9038/9.82
    execution time (avg/stddev):   60.0368/0.02
发表回复